Which defensive line position is the most valuable?
SIS Football Analytics Challenge | July 2020
Sam Struthers & Adrian Cadena
Sports Info Solutions mentioned this project as one of the highlights of the competition. Source code here.
Challenge
On every down, the defensive line does its best to stop either the run or the pass. Stopping opposing offenses is no easy task; it requires a coordinated effort from the three levels of defense. Analyzing defensive line play is an intricate process in football analysis since we don’t know each player’s assignment. Another challenge is determining which one of the defensive line positions is the most “important.” In other words, which position should front offices pay in a salary cap league like the NFL? Sports Info Solutions asked themselves the same question and decided to start a competition to find out. To join the contest, participants had to donate to the United Negro College Fund. A worthy cause.
Not all situations are created equal.
Due to the game’s nature, it is crucial to separate pass and run defense situations; therefore, we will analyze those two separately. We will also be making clear distinctions between 3-DL-front defenses (Front 3) and 4-DL-front defenses (Front 4)
What is Talent?
For practicality, we will define talent as “individual ability.” We measure ability by quantifying the positive or negative impact that a player has on a given play, game, or season.
What is positional value?
Positions where players’ ability is spread-out the most, will be considered more valuable. In our graphic example, we see two positions with different variances in player ability.
- Position “a” (low variance): the difference in impact from a high-end to a low-end player is not very pronounced.
- Position “b” (high variance): there is a massive difference in impact from a high-end to a low-end player.
- Position “b” is more valuable than “a.”

Positions
We defined four different “effective” positions and two “broad” positions. “Effective” Positions were determined using On-Field position and Technique Name. We also created an NT Position variable to differentiate players who line up primarily across from the Center/inside Guards.
- Effective Positions: NT, DT, DE, and OLB
- Broad Positions: EDGE (DE+OLB) and IDL(NT+DT)
- IDLs will sometimes be referred to as interior defenders and EDGE as EDGE defenders.
Run Defense Analysis: Evaluation Method
Expected Points Added (EPA) is a measure of play efficiency. EPA allowed is considered Defensive EPA (DEPA). EPA is an excellent way to account for down/distance situations as opposed to raw Offensive Yardage
Following the principle from [Yurko, Ventura, Horowitz 2019], we will be finding the individual defensive points added (iDPA) for each player:
“We refer to an intercept estimating a player’s average effect as their individual points/probability added (iPA), with points for modeling EPA and probability for modeling WPA. Similarly, an intercept estimating a team’s average effect is their team points/probability added (tPA)” [Yurko, Ventura, Horowitz 2019]
Our goal will be to take iDPA a step further by only looking at plays in which the player had a chance to be involved; we will call it: Credited Individual Defensive Points Added (cIDPA)
Mixed Effects Model — Run: Finding a player’s intercept
To solve our underlying question, we built a Mixed-effects model to find each player’s DEPA intercept; we call this IDPA.
For a description of the variables, please refer to our submission.
- Response variable: Resulting EPA on the play
Fixed Effects = mean_dist + min_dist + min_dist_2 + distance_from_gap* + num_DT + num_NT + num_DE + num_OLB + Yardline_100 + ScoreDiffRandom Effects = PlayerId:distance
Here is where IDPA turns into cIDPA. We are trying to credit EPA only when the defender is close enough to impact the play.
- By making each player interact with distance, we can look at each player’s intercepts at each span.
- We kept only each player’s intercepts when they are close or at mid-distance from the designed run.
- We grouped by the player using their mean intercept (close and mid-distance). The mean is each player’s cIDPA
Mixed Effects Model — Run: Results
In Front 3:
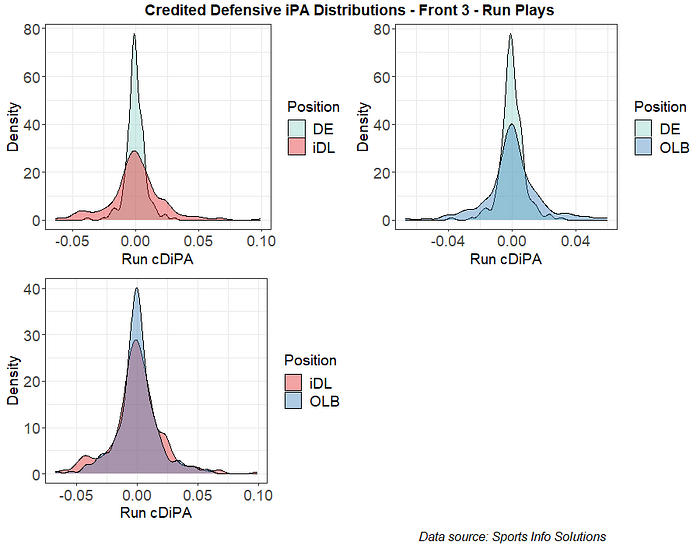
In run defenses, from high to low, the order of positional value is the following:
- IDL (variance: 4.67e-04)
- OLB (variance: 2.99e-04)
- DE (variance: 6.03e-05)
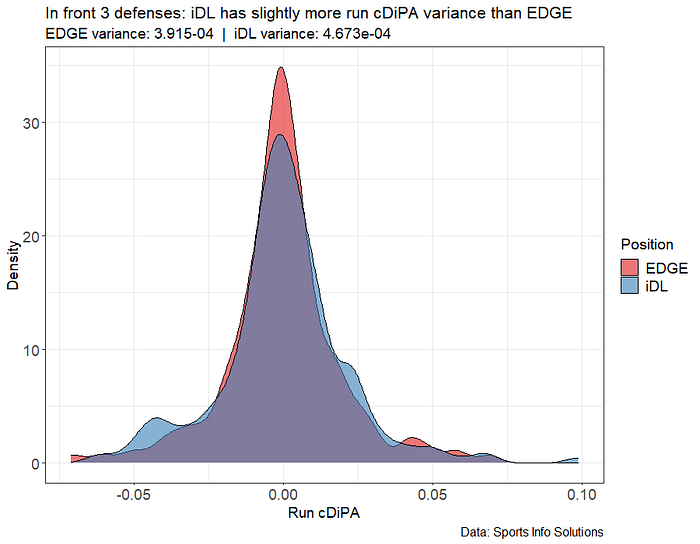
In a front 3 run defense, when comparing our two broad positions (IDL vs. EDGE), we find they have similar variance. However, IDL Defenders still carry a bit more variance.
In Front 4:
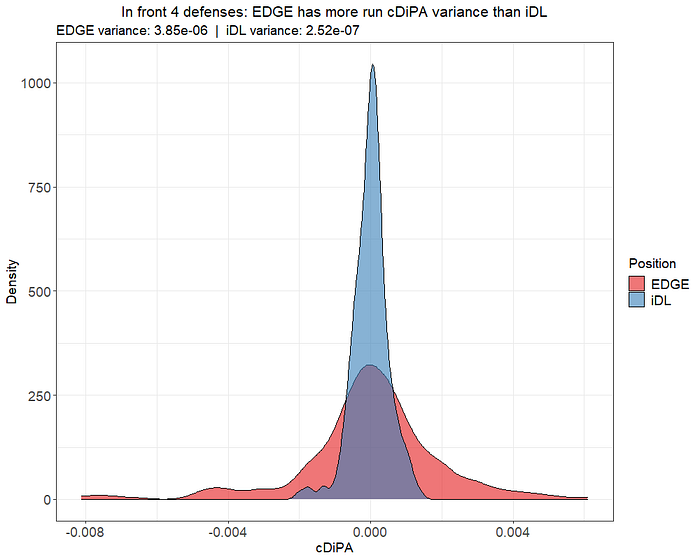
Our model found that DE is significantly more ‘valuable’ than IDL in a front 4 run defense.
Run Defense Analysis: Interpretation
IDL defenders are the most valuable players in a front 3 defense when defending the run, slightly over EDGE defenders (specifically OLBs). It makes sense that IDL would have much more importance in a front 3 than in a front 4, as they have twice the responsibility of a front-4 IDL. DE is the most valuable position in a front 4 defense when defending the run. When defending the run, EDGE positions are valuable regardless of base defense (either 3–4 or 4–3). Individual talent is considerably more impactful in a front 3 than a front 4 defense when defending the run. When comparing both fronts' variances, we can see that variances are more considerable in the front 3 defenses.
Pass Defense Analysis: Evaluation Method
Sacks are the most impactful play that a DL can have in the pass-game. [Hermsmeyer, 2020]. Counting total sacks is considered a “noisy” metric since the pressure-to-sack conversion rate does not carry from season to season. [Riske, 2020]. Riske shows that “lucky” players (high pressure-to-sack conversion rate during a season) often overproduce “skilled” players (high pressure-rate during a season) in terms of cumulative EPA. We didn’t feel comfortable using defensive EPA, sacks, or pressure-to-sack rate to measure individual talent because of the previously mentioned reasons. Instead, we will focus on pressures, specifically how much more likely a player is to pressure a QB than the average. We will try to find the increased probability that each player represents (player i), when the goal is to Pressure the QB, in the form of Log-Odds.
We are controlling for specific parameters in this analysis and only accounting when player i is rushing. We are not predicting whether the QB will be pressured during the play, but whether player i will pressure the QB
We call our final product: iLog-Odds of Pressure.
How impactful are QB pressures?
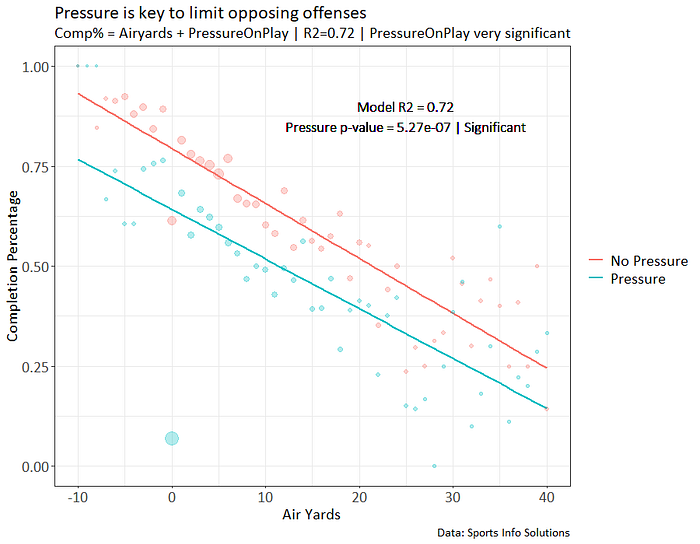
As our plot shows, QB pressures significantly reduces avg completion % regardless of Air Yards.
During weeks 7–19 of the 2019 season:
- Avg EPA/Pass without pressure: 0.204
- Avg EPA/Pass with pressure: -0.40
Mixed Effects Logistic Regression — Pass: Finding a player’s intercept
We built a Mixed-effects logistic model to find each player’s Log-Odds of Pressure intercept, which we call iLog-Odds of Pressure.
For a description of the variables, please refer to our submission.
Response variable = Player i pressuring the QB during play nFixed Effects = ToGo:Down + Yardline_100 + Down + ToGo + ScoreDiff +shotgun + blitz + (number of players from other positions pressuring)Random Effects = PlayerId:IsRushing
By making each player interact with the IsRushing variable, we can look at each player’s intercepts when rushing the pass. We kept only each player’s intercepts when they were rushing the passer: iLog-Odds of Pressure.
Mixed Effects Logistic Regression — Pass: Results
Front 3:
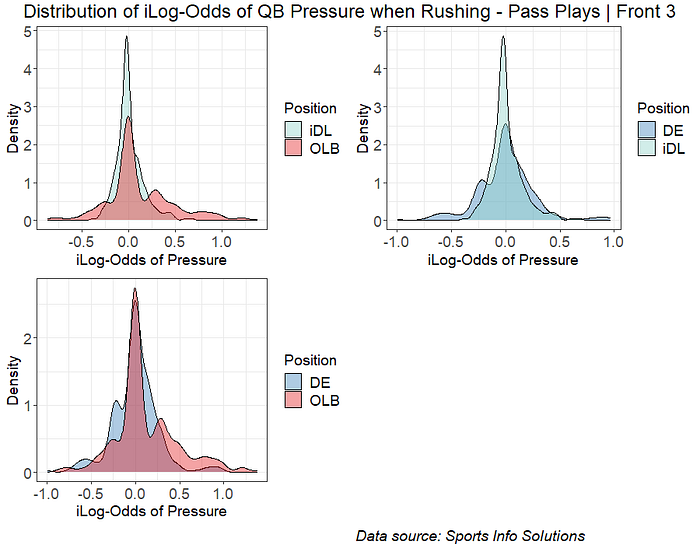
In Front 3 pass defenses, from high to low, the order of positional value is the following:
- OLB (variance: 0.130)
- DE (variance: 0.028)
- IDL (variance: 0.022)
Front 4:

We are analyzing broad positions as we did in the run analysis. IDL is slightly more valuable than DE in front 4 pass defenses
Front 3

When comparing broad positions, EDGE Defenders are more valuable than IDL in a front 3 pass defense.
Pass Defense Analysis: who helps who?
We found EDGE defenders are more valuable than IDLs when defending the pass in a front 3 defense. Also, that IDL position is slightly more valuable than DE when defending the pass in a front 4 defense. The model we used to estimate IDL variance considered EDGE pressure. The model we used to estimate EDGE variance did the same with IDL. Now we are interested in finding out which position helps the other the most.
To address this, we looked at:
- Avg. EPA for each player lined-up in position a when they sacked or pressured the QB during the play, and position b was pressuring the QB during the play
- Same as previous, but when position b was not pressuring the QB during the play
- Then, we ran simulations and compared the sample-mean distributions of both scenarios for both positions.
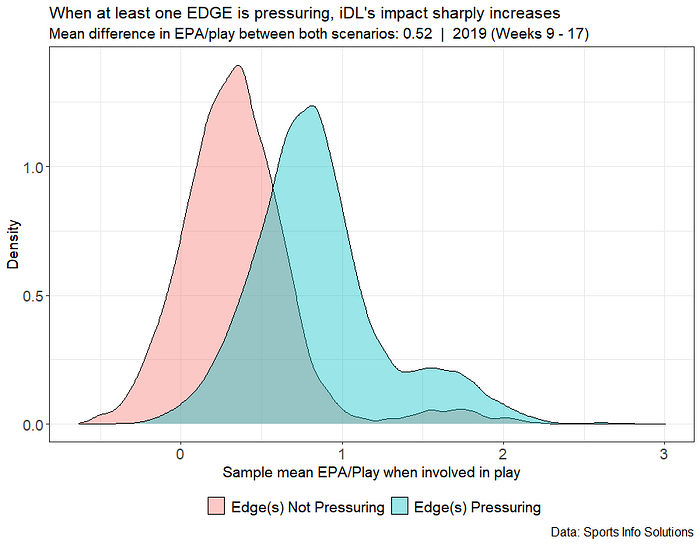
Generally, IDL players' average impact sharply increases when there is one or more EDGE pressuring the QB during the play. The difference between the mean of these two distributions, in these simulations, was 0.52 (pressure — no pressure from other position)
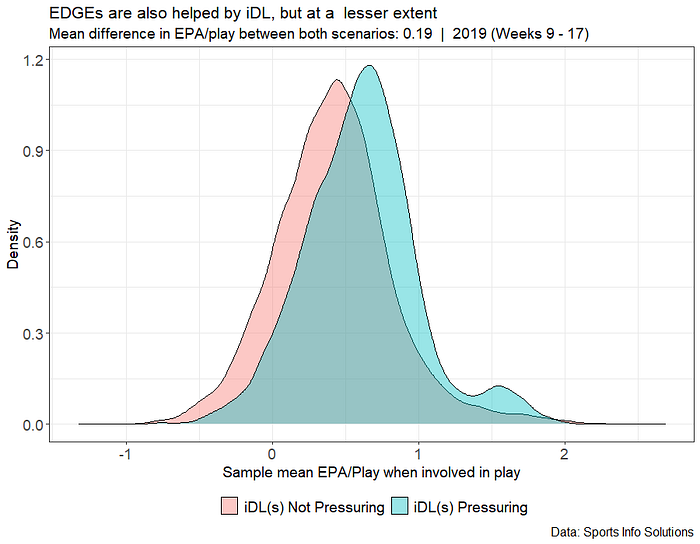
Generally, EDGE players' average impact increases when there is one or more IDL pressuring the QB during the play. The difference between the mean of these two distributions, in these simulations, was 0.19 (pressure — no pressure from other position)
After looking at both results, we determined that EDGEs help IDLs to a greater extent.
Pass Defense Analysis: Interpretation
In a front 3 pass defense, all positions are relatively valuable (compared to a front 3 run defense). However, OLB is still most valuable, with DE as the second. In a front 4 pass defense: IDL is more valuable than DE; however, the difference is narrow. When taking the “who helps who” analysis into consideration, we believe there is an argument for DE being more valuable. Individual talent is considerably more impactful in a front 3 than a front 4 defense when defending the pass. When comparing both fronts’ variances, we can see that variances are more extensive in the front 3 defenses. The distribution of talent in pass defense seems to be distributed more equally among DL positions than run defense.
Works Cited
1.Yurko, R., Ventura, S., & Horowitz, M. (2019). nflWAR: a reproducible method for offensive player evaluation in football, Journal of Quantitative Analysis in Sports, 15(3), 163–183. DOI: https://doi.org/10.1515/jqas-2018-0010
2.Hermsmeyer, J. (2020) Exactly How Much Does A Great Pass Rush Hurt An Offense? https://fivethirtyeight.com/features/exactly-how-much-does-a-great-pass-rush-hurt-an-offense/
3.Riske, T. (2020) PFF Data Study: Debunking the myth of the “sack artist“ https://www.pff.com/news/nfl-pff-data-study-sack-artist-pass-rushers
4.Walder, S. SethWalder. (2019, Dec 19).Double team rate as an edge rusher (x) by pass-rush win rate as an edge rusher (y) https://twitter.com/SethWalder/status/1205222343120957449?ref_src=twsrc%5Etfw%7Ctwcamp%5Etweetembed%7Ctwterm%5E1205222343120957449%7Ctwgr%5E&ref_url=https%3A%2F%2Ftheramswire.usatoday.com%2F2019%2F12%2F13%2Fnfl-rams-aaron-donald-pass-rush-win-rate%2F
